Website heatmap is a data visualization tool that shows how website pages function.
A website heatmap is a graphical representation of data as a diagram or map, with different colors signifying distinct data sets and values.
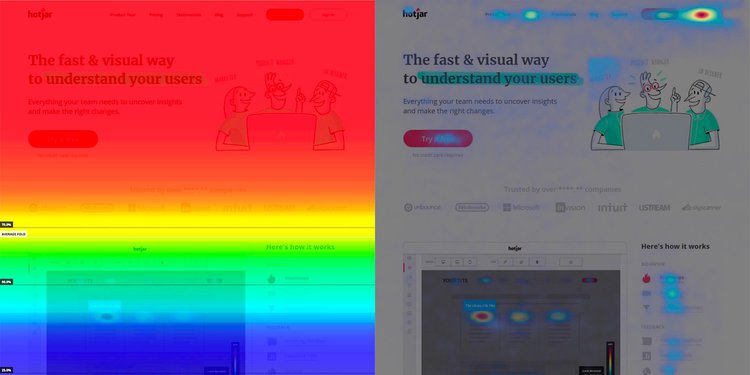
Website heatmaps employ a warm-to-cold color scheme to represent a web page’s performance, with the warmest hue signifying the most visitor interaction.
It employs colors to show visitor interaction on a page. Website heatmaps show which sections of a webpage have the greatest visitor interaction, where visitors click the most, whether they click on the CTA, and other visitor behavior data.
Heatmap solution let you optimize your site based on visitor behavior. They remove number confusion and simplify data.
Heatmap types
- Heatmaps help you understand visitor behavior, so you can personalize your website. It shows how well your website’s pages offer a decent user experience and answer users’ questions. AI-powered VWO’s free heatmap tool shows how visitors interact with page components.
- Clickmaps show which pages are most and least popular. Clickmaps assist discover navigational gaps by graphically displaying your website’s most popular parts.
Clickmaps track:
- Images
- Links
- CTA
- Navigation
- Scrollmap shows how visitors scroll. It shows how far people scroll and where they spend the most time. It informs you how many visitors went to the bottom of a page, how many browsed through 50% but not 100%, where most visitors left a page, etc.
Based on scrollmap reports, position the most important web page items in high-traffic areas.
Scrollmaps don’t simply show info in different hues; they also provide percentages to show how many viewers scrolled down your page. They find overlooked content.
Scrollmaps use for:
- Calculate the page length beyond which visitors don’t scroll, determine whether they access material below the fold, and notice fake floor or false bottom.
- Determine where visitors spend time and where they lose interest.
- Determine where to put essential pieces like CTAs.
- Mouse heatmap
Mouse Tracking Heatmaps (sometimes called Hover Maps, Attention Maps, Move Maps) show where visitors hover their pointer.
Mouse tracking heatmaps can:
- Identify which parts visitors frequent and insert key information, CTAs, ads, etc. there.
- Analyze where a visitor’s mouse stops and where they hover quickly to see where they’re looking.
Visitors commonly linger over sections they find fascinating or puzzling. Mouse tracking heatmaps may show where visitors spend the most time.
Not usually true, particularly for online news outlets. Due to ‘parkers’ Parkers leave their cursor in one location regardless of what they’re reading or where they are. Overlooking the likelihood of parkers altering your heatmap data causes data pollution. Time-based segmentation may help.
Let’s say your most-read item has a 6-minute read duration. By giving visitors a 4-minute delay, you may segregate people who spend less than 10 minutes on the website. This manner, you include just visitors and users who really read the item in your research and avoid data contamination from parkers.
- Heatmap eye-tracking
The two are sometimes confused. Eye-tracking heatmaps display the most enticing components of a website for visitors as “hot” and “cold” places by measuring eyeball movement.
Humans value sight over other senses, which may benefit companies. An eCommerce shop might profit if they know what website users look at most. Knowing what parts capture a visitor’s attention most and finding components that might benefit from being put there can help firms make data-backed website adjustments that meet visitor expectations. Eye-tracking heatmaps show how engaging website graphics are.
Eye-tracking heatmaps can:
- Determine where your visitors are seeking for information.
- Identify visual or textual website elements that distract visitors.
- Track visitors’ gaze patterns to position crucial material and graphics in eye-catching areas.
Making heatmaps
While heatmaps may be made using Google Sheets/Excel and Google Analytics for visitor behavior insights, integrated technologies like Creabl (https://creabl.com/) heatmaps enable you to evaluate your website’s performance for CRO. Creabl heatmaps analyze millions of engagement data with a little code snippet called Smartcode injected into your website.