Do you ever look around in a meeting and see completely unengaged people? Is there a speaker giving a presentation who sounds much like the teacher on Ferris Bueller’s Day Off? Even worse, are you the person giving that presentation?
Sometimes information can be boring to others but it does not have to be. If you have not used infographics, keep reading to find out why you should.
Infographics Help You Tell a Story
No matter what information you are trying to convey, infographics use data to tell a story. Many people look at data as boring and a bunch of statistics they cannot understand. By using infographic examples, you can easily display what you want others to see.
A lot of people are visual learners and throwing a lot of numbers at them does not work. Think of how many times you have seen sports teams ranked and television shows competing for the number one spot.
In marketing, infographics are used frequently. This is one of the most effective ways to convey information that could be hard to understand.
What Is An Infographic?
An infographic is a way to visually tell a story. This can be a template, chart, or any other visual way to show data. It is used to enhance comprehension.
There are many ways to use infographics. One of the easiest ways is to use a tier list maker. That will show in a visual form, how items are ranked.
This can be first to last or best to worst. Many YouTubers use tier ranking when discussing books, movies, or their favorite series.
Now you do not have to view a complex document filled with data that seems confusing. You can easily view it in a story form. Infographics tell stories in a simplified way.
Making Infographics
This may seem like a plan that interests you, but where do you start? How do you make an infographic?
It is now easier than ever to use infographics for your purpose and to design them exactly the way you want. For example, if you want a tier list maker to show rankings, there are templates to use. You just need to choose the one you want and fill in the required information.
Maps can also be used as infographics to show the whole picture of what is happening in a given location. We often see those today with the COVID-19 pandemic.
They are often used in articles giving directions are how to do something. This can be anything from plumbing to clearing the cache on your Apple device. Pictures are easier to understand for most people than reading multiples lines of instruction.
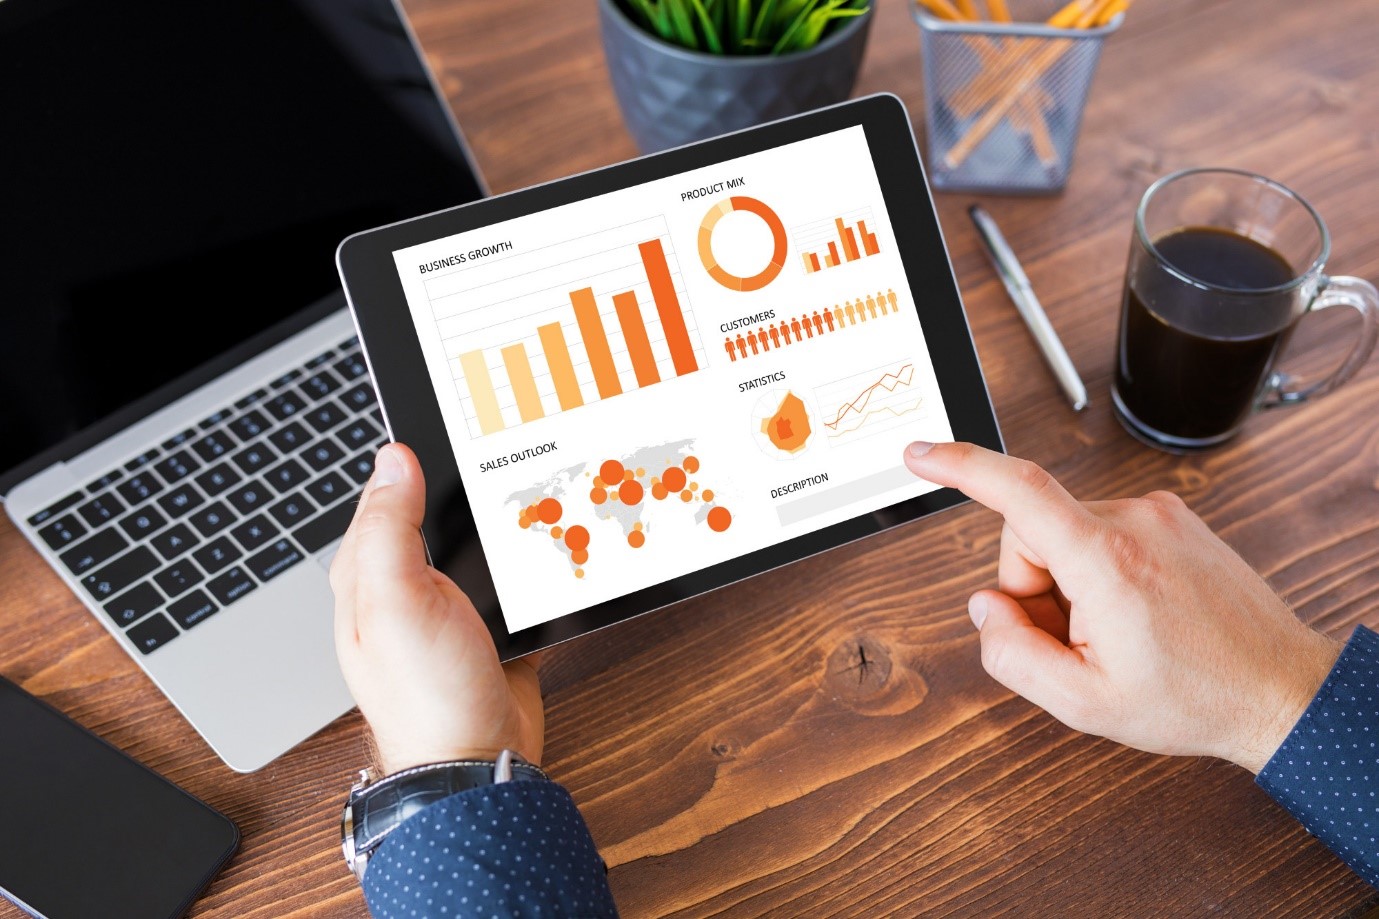
Using Infographics for Business
In today’s busy world, we are often required to give and receive information at a fast pace. If you have tons of data thrown at you in a short amount of time it can become stressful and hard to understand. Infographics make all that easy and concise.
With a few clicks, you can view information and understand it without the need to read pages of information. This makes using infographics efficient effective. Keep following us for more tips like these.